StackGenVis: Alignment of Data, Algorithms, and Models for Stacking Ensemble Learning Using Performance Metrics
https://doi.org/10.1109/TVCG.2020.3030352
You can not select more than 25 topics
Topics must start with a letter or number, can include dashes ('-') and can be up to 35 characters long.
|
|
5 years ago | |
|---|---|---|
| .. | ||
| example | 5 years ago | |
| lib | 5 years ago | |
| LICENSE | 5 years ago | |
| README.md | 5 years ago | |
| axes.js | 5 years ago | |
| package.json | 5 years ago | |
| properties.js | 5 years ago | |
README.md
gl-axes3d
Draws axes for 3D scenes:
Example
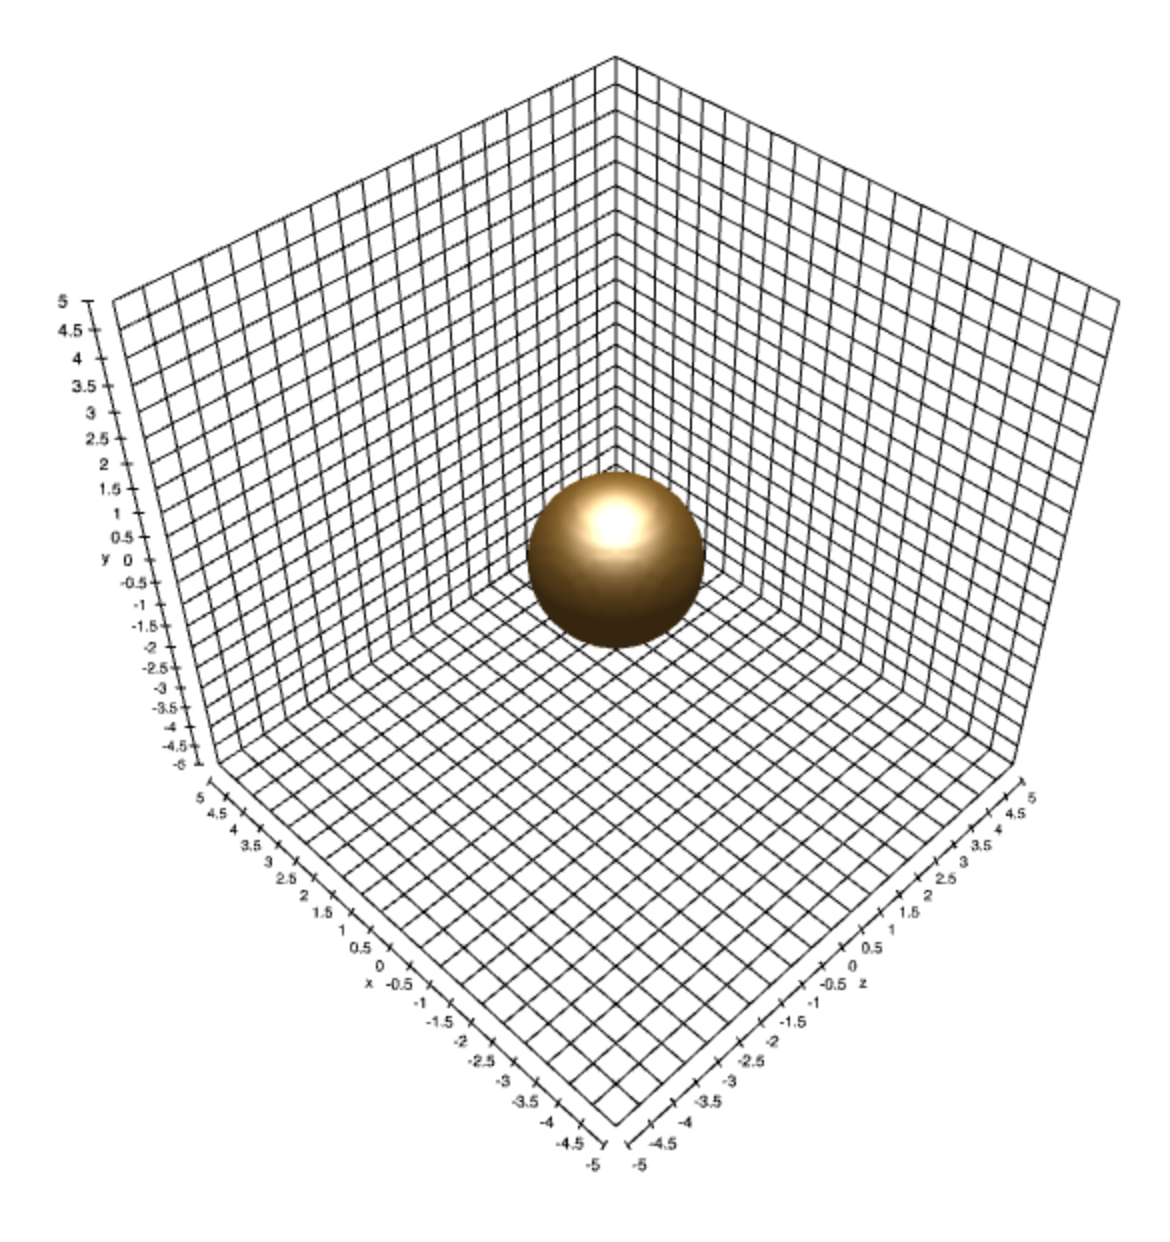
Here is a simple example showing how to use gl-axes to visualize the extents of an isosurface:
//Load shell
var shell = require("gl-now")({ clearColor: [0,0,0,0] })
var camera = require("game-shell-orbit-camera")(shell)

//Mesh creation tools
var createMesh = require("gl-simplicial-complex")
var polygonize = require("isosurface").surfaceNets
var createAxes = require("gl-axes")

//Matrix math
var mat4 = require("gl-matrix").mat4

//Bounds on function to plot
var bounds = [[-5,-5,-5], [5,5,5]]

//Plot level set of f = 0
function f(x,y,z) {
  return x*x + y*y + z*z - 2.0
}

//State variables
var mesh, axes

shell.on("gl-init", function() {
  var gl = shell.gl

  //Set up camera
  camera.lookAt(bounds[1], [0,0,0], [0, 1, 0])

  //Create mesh
  mesh = createMesh(gl, polygonize([64, 64, 64], f, bounds))

  //Create axes object
  axes = createAxes(gl, {
    bounds: bounds
  })
})

shell.on("gl-render", function() {
  var gl = shell.gl
  gl.enable(gl.DEPTH_TEST)

  //Compute camera parameters
  var cameraParameters = {
    view: camera.view(),
    projection: mat4.perspective(
        mat4.create(),
        Math.PI/4.0,
        shell.width/shell.height,
        0.1,
        1000.0)
  }

  //Draw mesh
  mesh.draw(cameraParameters)

  //Draw axes
  axes.draw(cameraParameters)
})
You can play with this demo yourself on requirebin.
Install
npm install gl-axes3d
API
Constructor
var axes = require("gl-axes3d")(gl[, params])
Creates an axes object.
glis a WebGL contextparamsis an object with the same behavior asaxes.update
Returns A new glAxes object for drawing the axes.
Methods
axes.draw(camera)
Draws the axes object with the given camera parameters. The camera object can have the following properties:
model- Is the model matrix for the axes object (default identity)view- Is the view matrix for the axes (default identity)projection- Is the projection matrix for the axes (default identity)
All camera matrices are in 4x4 homogeneous coordinates and encoded as length 16 arrays as done by gl-matrix.
axes.update(params)
Updates the parameters of the axes object using the properties in params. These are grouped into the following categories:
Dimensions and tick lines
boundsthe bounding box for the axes object, represented as a pair of 3D arrays encoding the lower and upper bounds for each component. Default is[[-10,-10,-10],[10,10,10]]tickSpacingeither a number or 3d array representing the spacing between the tick lines for each axis. Default is0.5ticksAlternatively, you can specify custom tick labels for each axis by passing in an array of 3 arrays of tick markings. Each tick marking array is an array of objects with the propertiesxandtextwhich denote the position on the tick axis and the text of the tick label respectively.
Tick text
tickEnablea boolean value (or array of boolean values) which selects whether the tick text is drawn. DefaulttruetickFonta string (or array of strings) encoding the font style for the tick text. Default'sans-serif'tickSizethe size of the font text in pixel coordinates. Default is computed from tick spacing.tickAnglea number (or array of numbers) encoding the angle of the tick text with the vertical axis in radians. Default0tickColora color (or array of colors) indicating the color of the text for each tick axis. Default[0,0,0]tickPada number (or array of numbers) encoding the world coordinate offset of the tick labels from tick marks. Default1
Labels
labelEnablea boolean value or array of booleanlabelTexta 3D array encoding the labels for each of the 3 axes. Default is['x', 'y', 'z']labelFonta string (or array of strings) representing the font for each axis. Default'sans-serif'labelSizethe size of the label text in pixel coordinates. Default is computed from tick spacinglabelAnglea number (or array of numbers) encoding the angle of the label text with the vertical axis in radians. Default0labelColora color array (or array of color arrays) encoding the color of the label for each axis. Default[0,0,0]labelPada number (or array of numbers) encoding the world coordinate offset of the labels from the data axes. Default1.5
Axis lines
lineEnablea boolean (or array of booleans) determining which of the 3 axes tick lines to show. Default istruelineWidtha number (or array of numbers) determining the width of the axis lines in pixel coordinates. Default is1lineMirrora boolean (or array of booleans) describing which axis lines to mirror. Default isfalselineColora color array (or array of color arrays) encoding the color of each axis line. Default is[0,0,0]
Axis line ticks
lineTickEnablea boolean (or array of booleans) which determines whether or not to draw the line ticks. Default isfalselineTickMirrora boolean (or array of booleans) which determines whether the line ticks will be mirrored (similar behavior tolineMirror). Default isfalselineTickLengtha number (or array of numbers) giving the length of each axis tick in data coordinates. If this number is positive, the ticks point outward. If negative, the ticks point inward. If0, the tick marks are not drawn. Default0lineTickWidtha number (or array of numbers) giving the width of the tick lines pixel coordinates. Default1lineTickColora color (or array of colors) giving the color of the line ticks. Default[0,0,0]
Grid lines
gridEnablea boolean (or array of booleans) determining which grid lines to draw. Default istruegridWidtha number (or array of numbers) giving the width of the grid lines in pixel units. Default is1gridColora color array (or array of color arrays) giving the color of the grid lines for each axis. Default is[0,0,0]
Zero line
zeroEnablea boolean (or array of booleans) which describes which zero lines to draw. Default istruezeroLineColora color array (or array of color arrays) giving the color of the zero line. Default is[0,0,0]zeroLineWidtha number (or array of numbers) giving the width of the zero line. Default is2
Background
backgroundEnablea boolean (or array of booleans) describing which background plane to draw. Default isfalsebackgroundColorthe color of each background plane. Default is[0.8,0.8,0.8,0.5]
axes.dispose()
Releases all resources associated with this axes object.
Credits
(c) 2014 Mikola Lysenko. MIT License